Showing posts with label Population In Ecosystems. Show all posts

Thursday, 20 April 2017

Populations In Ecosystem: - Conservation Of Habitats

- Conservation Of Habitats - 

 
Image result for conservationsSo what is conservation?


Conservation is the protection and management of species and habitats in a sustainable way.


What are the main reasons for conservations?
 
 
  1. Personal - maintaining our planet // supporting our life support system.
  2. Ethical - other species should be able to co-exist with us since they have been here for a much longer time than we have.
  3. Economics - long term productivity is greater if ecosystems are maintained in their natural (balanced) states. These organisms have a vast genetic pool of genes which have a capacity to make millions of substances // substances = valuable future sources.
  4. Culture and Aesthetic - Habitats provide variety to the environment and everyday life, for example, inspiring many writers or providing entertainment.
--------------------------------------------------------------------------------------------------------------------------
Image result for piecachu
Remember -
 
PEECA
 
Like PieCaChu - from Pokémon
 
P - Personal
E - Ethical
E - Economics
C - Culture
A - Aesthetics
 
 
--------------------------------------------------------------------------------------------------------------------------
 
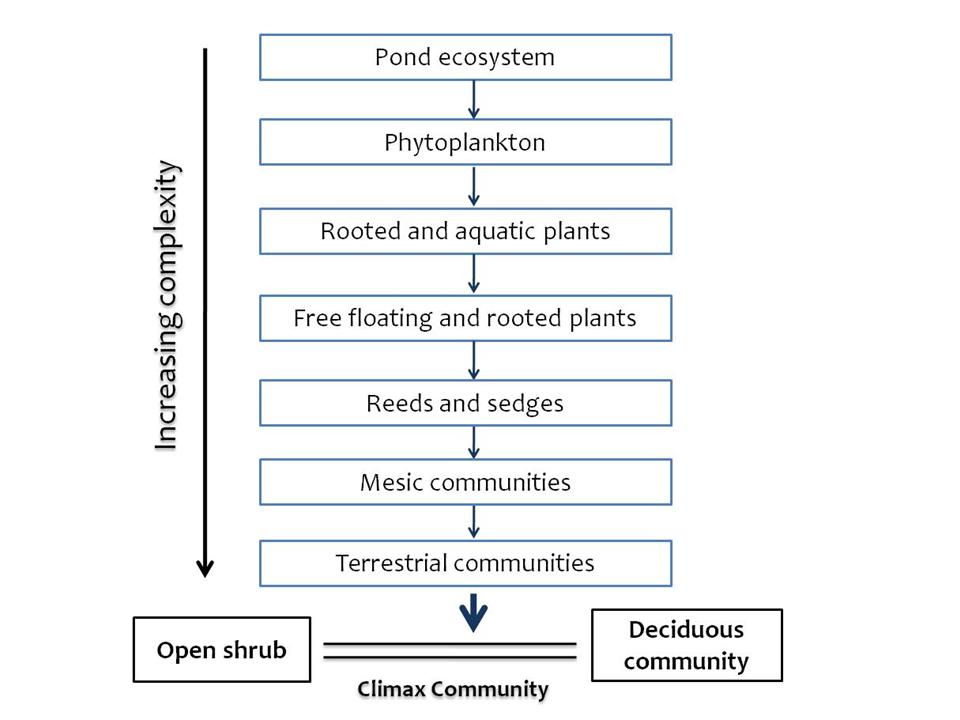
- So how are we able to conserve habitats by managing succession -
 
 
Species that had existed in the earlier stages no longer exist in the present due to the climax community. Their habitats have been destroyed as a result of succession or other species have out-competed the pioneering species, another would be due to human activities.
 
By conserving the habitats you would be able to prevent a change to the next stage so the species do not exist when it could have been prevented.
 
If the factors effecting further development of succession is removed then the ecosystem would develop in to a climax community naturally // = secondary succession.
 
 
What are the problems with conservation of habitats? 
 
 
There are conflicts with human needs and conservations, farming and habitats have always been a problem.  
With farming, the grass is needed for the cattle, however the cattle grazing using the grass would reduce the habitats for other species. Therefore a balance would need to be found between the two and to also maintain the sustainability of natural resources.Image result for farming and conservation


Tuesday, 18 April 2017

Populations In Ecosystems - Succession

- Succession - 


Succession occurs over a number of steps: 

At each of these new stages the species colonies and alter the environment at each stage. This could go either one of two ways:


  1. The environment is made less suitable for the existing species. Which means that the new species may out compete the existing species as they may have adapted to the environment // would have a given advantage. 
  2. The environment is made more suitable for different species that have different adaptations. This species may be out competed by the better adapted new species

Stages of succession 


  1. Single organisms rapidly multiple through asexual reproduction // to build the population
  2. A vast quantity of wind-dispersed seeds/spores produced // reach isolated areas 
  3. Rapid germination of seeds // do not require a period of dormancy
  4. The ability to photosynthesise // light = available, other sources of food = not available 
  5. Soil has few or no nutrients // able to fix nitrogen from the air 
  6. tolerance/adaptations to the extreme conditions
There would need to be a stable state to find a balance in the equilibrium of species with few, if any, new species replacing those have become established. In this state there are many species that flourish // increase in biodiversity = climax community

The climax community is determined by the limiting abiotic factors

For examples - trees are unlikely to grow on mountains as the conditions are too cold and there is little soil for the roots to bury itself in to collect the required nutrients for the tree - especially at the start of succession. 

Image result for succession


During succession there are a number of common features that occur 

  • Non-living (Abiotic) environment becomes less hostile - soil forms // retains water & nutrients. 
  • A greater number and variety of habitats and niches - this produces 
  • Increased biodiversity - different species occupy these habitats // reaches peak in mid-succession // decreases as climax community is reached - in other words the dominant species out compete the pioneer species. 
  • More complex food webs 
  • Increase in biomass // during mid-succession. 
Secondary succession = when land has already sustained life however due to land clearance for agriculture for example, forest fire, the ecosystem returns to it's climax community // occurs more rapidly. Land has been changed/altered in a way that results in the climax community being different

This is an example of an ecological succession :
Image result for ecological succession flowchart


Populations In Ecosystems: - Investigating Populations

- Investigating Populations - 

Investigating population:
There are a number of sampling techniques
- random sampling using frame quadrats or point quadrats
- systematic sampling along a belt transect  


Quadrats:

There are two types of quadrats that are frequently used.

Point quadrat consisting of horizontal bar supported by two legs. The intervals are set along the horizontal bar are ten holes each of which are long pins may be dropped. Each species that is touched by the pin is recorded.
Frame quadrat is a square frame divided by string or wire into equally sized subdivisions it's designed to make it more compact, so it's easy to store and transport. It can be placed in the areas being studied.


Image result for point quadrats vs frame quadrats

Point Quadrat Frame Quadrat


There are three factors to consider when using quadrats:

1 )The size of the quadrats to use = this depends on the size of the animal or organism being counted and how they are distributed within the area. Larger species require larger quadrats. In an area which the species are not largely distributed a large number of small quadrats would give a more representative result than a small number of large ones.

2)The number of sample quadrats to record within the study area = larger the number of sample quadrats the more reliable the results will be. As the recording the species within a quadrats

3)The position of each quadrat within the study area = produce a statistically significant results a technique - random sampling must be used

Sampling at random
To obtain a true random sample is to:
> Lay out two long tape measures at right angles, along two sides of the study area.
> Obtain a series of coordinates by using random numbers taken from a table or generated by a computer.
> Place a quadrat at the intersection of each pair of coordinates and record the species within it.

Systematic sampling along belt transects
- Species would need to be measure in a systematic system rather than a random manner. This is important to measure gradual change in the communities of plants and animals to take place.
An example of this would be distribution of organisms along a line of succession. Stages of succession is shown using transects. A belt transect can be made by stretching a string or tape across the ground in a straight line. Frame quadrat is then laid down alongside the line and the species within it recorded. It is then moved along it's own length along a line and the process is then repeated - a record of species in a continuous belt.

Measuring abundance

Random sampling with quadrats and counting along transect used to obtain measures of abundance.
Abundance - number of individuals of a species within a given area for species that don't move around. This is measured in several ways:
  • Frequency = likelihood of a particular species occurring in a quadrat.
  • Percentage cover = an estimate of the area within a quadrat than a particular plant species covers. This is useful where a species is difficult to count, data could be collected rapidly and individual plants do not need to be covered. Not useful when organisms occur in several overlapping layers.
It's necessary to ensure that the species sample is large, the larger the sample the more representative the data is.


Mark release recapture techniques

Estimated population size  = total no. of individuals in 1st sample X total no. 2nd sample     
                             No. of marked individuals recaptured

The technique requires a no. of assumptions:
  1. Proportion of marked to unmarked individual in 2nd sample is the same as the proportion of marked to unmarked individuals in the population as a whole.
  2. Marked individuals released from 1st sample distribute themselves evenly amongst the remainder of the population have sufficient time to do so.
  3. Population has a boundary = no immigration into or emigration out of the population.
  4. Few death and births within the population.
  5. Method marking not toxic to the individual nor does it make the individual more conspicuous therefore more liable to predation.
  6. Mark or label is not lost or rubbed off during the investigation.


Populations In Ecosystems: - Predation

- Predation - 

Predation
A predator is an organism that feeds on another organism known as their prey.

Predation

→ Occurs when one organism is consumed by another. Evidence of predation and prey in the laboratory does not reflect what happens in the wild. At the same time the it's difficult to obtain reliable data on natural populations as it's not possible to count all of the individuals in the population. Size can only be estimated.

Effect of predator-prey relationship on population size:
Image result for predator prey effect on population

The relationship between predators & their prey, it's effects on the population is shown in steps as followed:


Predator eat their prey, prey population decreases.
Fewer prey available predators in greater competition with each other for the other prey.
Predator population then decreases as some are unable to obtain enough prey either survival or for them to reproduce.
The prey population increases as they are not being hunted for.
More prey available for food.
Predator population in turn increases.

These periodic population crashes are important in evolution as there is a selection pressure // means that those individuals who are able to escape predators or withstand diseases or adverse climate change are more likely to survive and reproduce.


An example of this would be: the Canadian lynx and the snowshoe hare:

Image result for predation graph

There has been long observation of the population of snowshoe hare, and it is shown that there is fluctuations in cycles. It can be said that various factors caused the fluctuations i.e the predator Canadian lynx also plays a part in this as well as the availability of food and other sources.


Populations In Ecosystems: - Competition

- Competition - 


Intraspecific competition  

→ Occurs when individuals of the SAME species compete with one another for resources such as food, water, breeding sites. It is the availability of the resources that determines the size of the population.
Image result for intraspecific competition
Example of this would be the squirrels in the picture → 


Interspecific competition  

→ Occurs when individuals of DIFFERENT species compete for resources such as food, light, water. When a population of the two species are in competition one will normally have a competitive advantage over the other.
As a result this species would increase in size gradually whereas the other would begin to diminish. This is if the conditions remain the same competitive exclusion principle.

Image result for interspecific competition

An example of this would be shown in this picture →


----------------------------------------------------------------------------------------------------------------------------------
To remember the difference between interspecific and intraspecific competition remember that:

INTRASPECIFIC = has RA in the word and SAME has an A within the word.

INTERSPECIFC = has ER in the word and DIFFERENT has an ER within the word.
--------------------------------------------------------------------------------------------------------------------------


This graph shows the effects of interspecific competition on population size. 


Population In Ecosystem: - Variation In Population Size

- Variation In Population Size -


Plotting growth curves ⇒ When the population growth is slow over a long period of time then it is possible to plot the recorded numbers on a graph against time.

It's not possible if the population increase was rapid over a short period of time.

Example of this would be microorganisms


https://lh3.googleusercontent.com/hLs9XnWyMs7DrLkoaCm_Ngz_daMMZ9BxonPNv5_zBZAaNmZJ0d9e-3UMd-8UFJo_DiWysHz-IkAm7sSDKGWFjm2AquJixDKGLf9TELXOubfE6KJsk5smGyCfNfNonSj4KOCo8WON

Graph A ⇒ shows what the curve will look when attempting to record the increasing population of the microorganism as they reproduce asexually increasing over a short period of time.
Graph B ⇒ shows what the curve will look when using logarithmic scale to represent the number of bacteria.

Population size

All the factors needed for the growth of the population are presented, there are no limiting factors although there are things that change in time which can affect population size including:
  1. Availability of resources
  2. Nesting sites
  3. Shelter
  4. Predation
  5. Parasites
  6. Change in weather/ seasons
As a result the population growth slows possibly ceases altogether and the population size may diminish.

Abiotic factors:

Abiotic conditions that influence the size of the population include:

  1. Temperature > each species has a different optimum temperature, further away from this optimum, the fewer individuals in a population are able to survive and smaller is the population that can be supported.
  2. Light > ultimate source of energy for most ecosystem
  3. pH > this affects the action of enzymes each enzyme has an optimum pH at which it operates most effectively
  4. Water and humidity > when water is of limited supply populations are small and only consist of species that are well adapted to living in dry conditions. Humidity affects transpiration rates in plants and evaporation of water from the bodies of animals.

Equations:


Population growth = [ births + immigration ] - [ deaths + emigration ]


Percentage population growth rate  = population change during the period      X 100
[ in a given period ]                  population at the start of the period    

Biological Molecules: - Carbohydrates

- Carbohydrates -   - Monosaccharides -  The monomer for carbohydrates is called monosaccharides.  Common for...